Point Type Distribution
Point Type Distribution
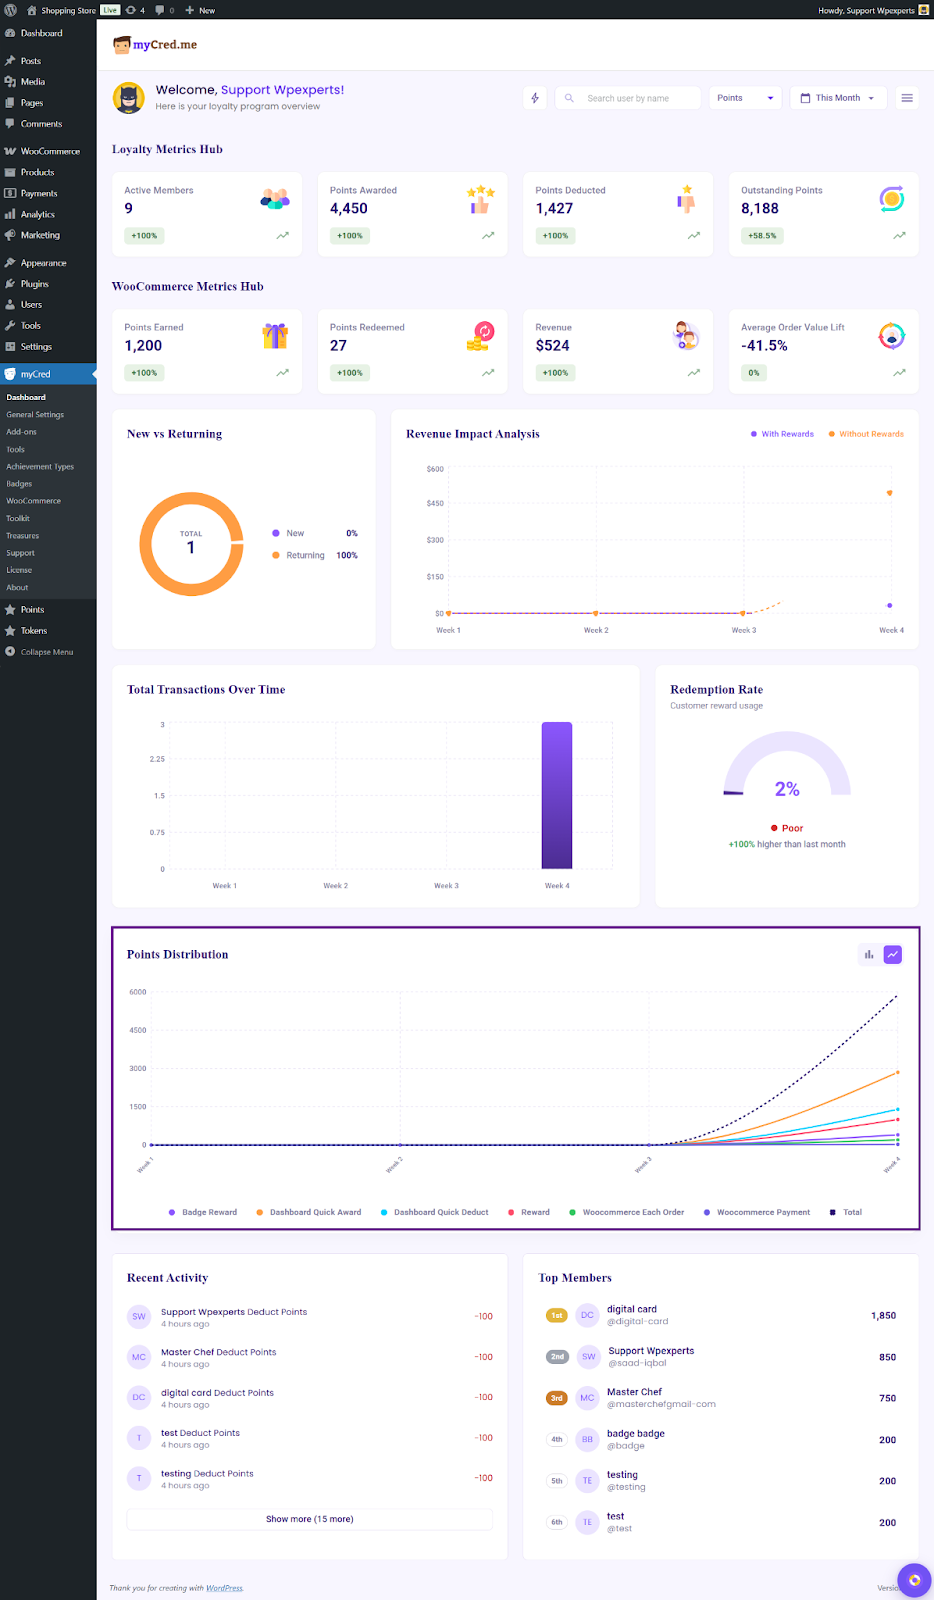
This bar chart illustrates how points are being distributed across different time periods, with separate tracking for bulk assignments and total points. Use this to identify unusual patterns or spikes in point allocation.
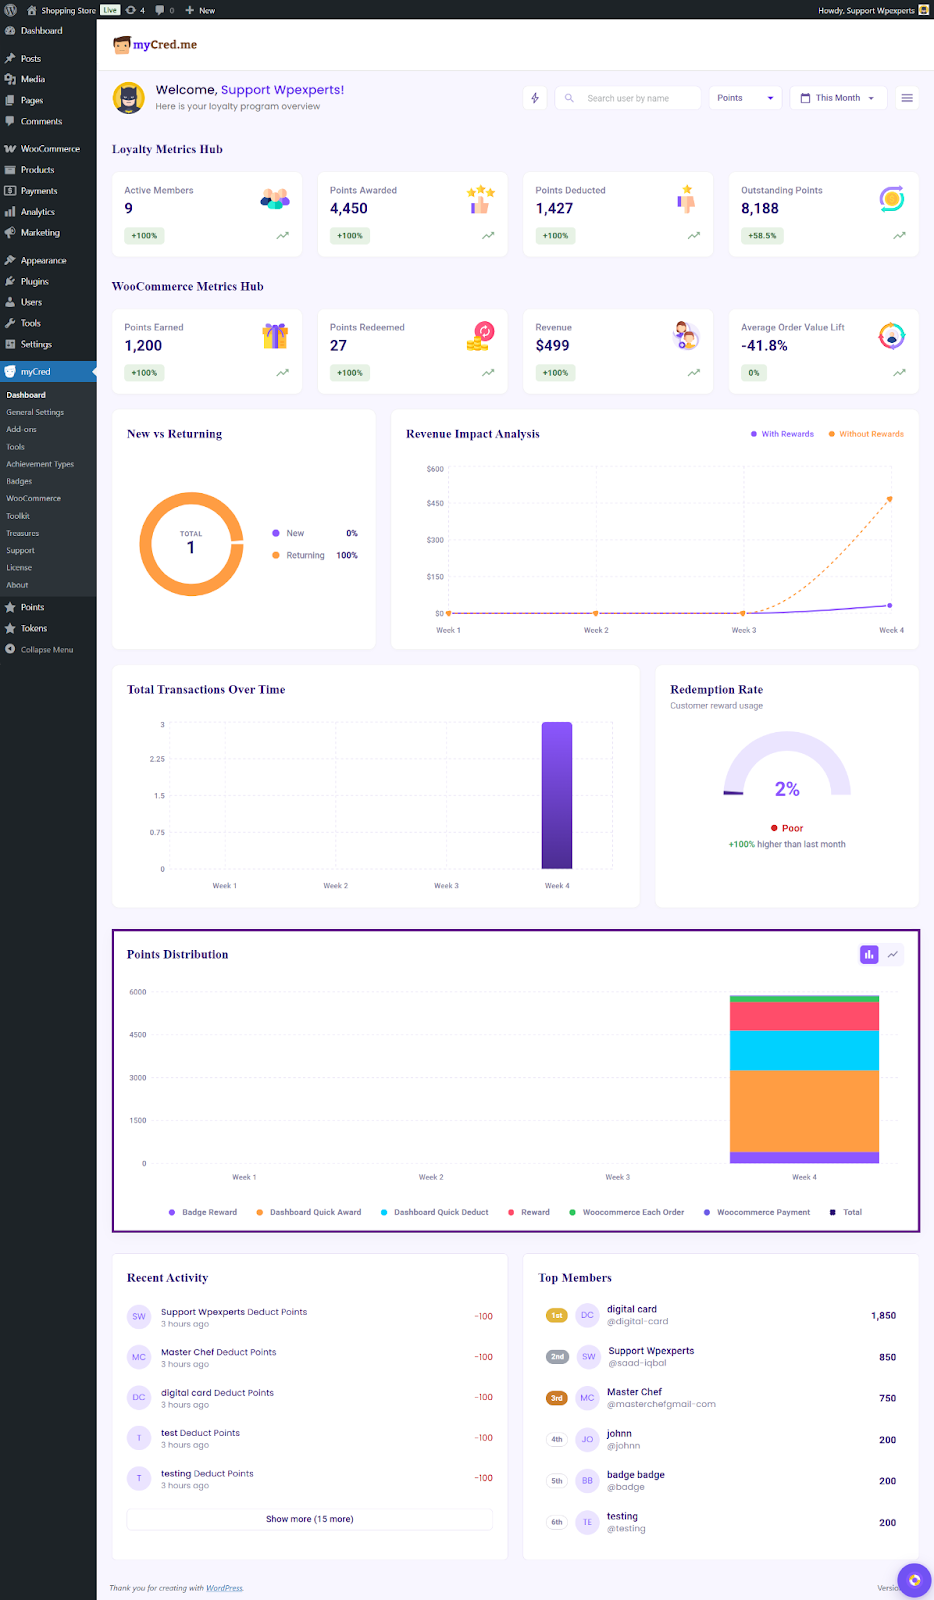
Another view of the points distribution is provided as a line chart, alongside the bar graph, to cater to the user’s preference and provide a clearer visual representation of trends.