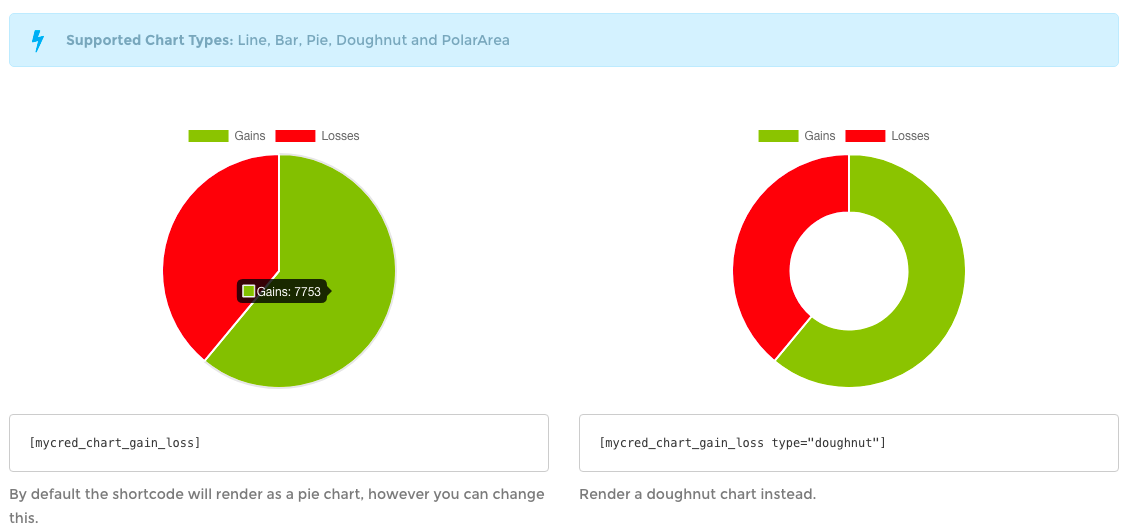
mycred_chart_gain_loss
Description
This shortcode will render charts based on the amount of points that has been given to users vs. the total amount taken for a particular point type. Uses Chart.js 2.7.0
Available since version 1.8
Shortcode Attributes
| Attribute | Type | Required | Default | Description |
|---|---|---|---|---|
type |
string | No | pie | The chart type to render. Supports: pie, doughnut, line, bar and polarArea |
ctype |
string | No | mycred_default | The point type we want to show data for. Should only be used when you need to show data for a custom point type. |
title |
string | No | - | Option to set a title for the chart. |
animate |
int | No | 1 | If the chart should be animated (1) or not (0). |
bezier |
int | No | 1 | If line charts should use bezier curves (1) or not (0). |
labels |
int | No | 1 | If labels should be shown in the chart (1) or not (0). Not all chart types use labels, it is mainly for bar and line charts where we have both an x and y axis. |
legend |
int | No | 1 | If a legend should be shown in the chart (1) or not (0). Not all charts show legends. |
width |
string | No | - | The chart canvas width. By default the chart will render full with of the container where the shortcode is used. Can be either a pixel value (without px) or a percentage value (with %). |
height |
string | No | - | The chart canvas height. Can be either a pixel value (without px) or a percentage value (with %). |
gains |
string | No | - | Option to use a different word than "Gains". |
losses |
string | No | - | Option to use a different word than "Losses". |
CSS Styling
.chart-container mycred-chart-container { }
.chart-container mycred-chart-container canvas.mycred-chart-canvas { }
Examples
Example 1: Default usage.
[mycred_chart_gain_loss]


