mycred_chart_circulation
Description
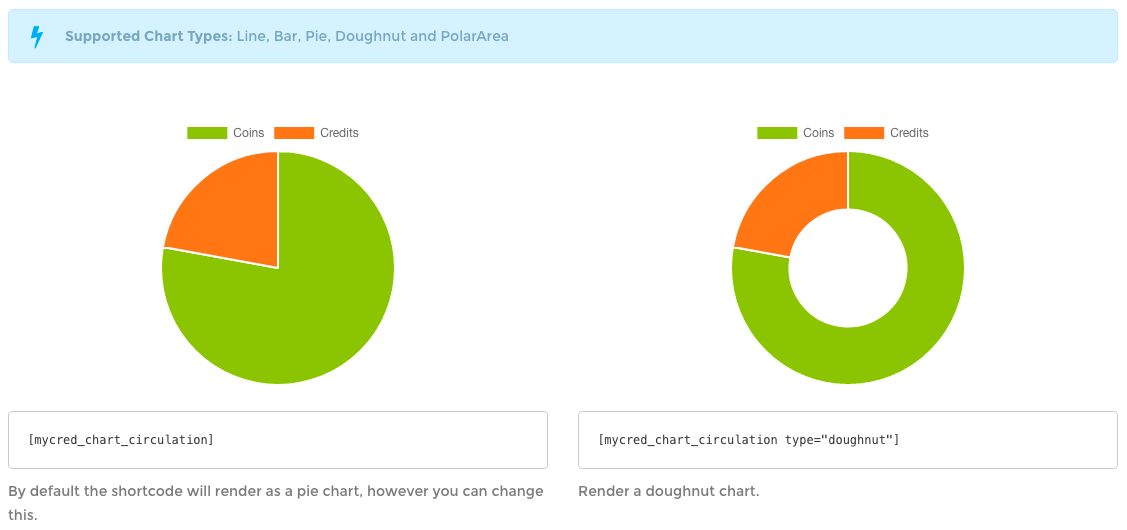
This shortcode will render charts based on the amount of points that currently exists amongst your users. The chart is segmented if you have more than one point type setup. Uses Chart.js 2.7.0
Available since version 1.8
Shortcode Attributes
| Attribute | Type | Required | Default | Description |
|---|---|---|---|---|
type |
string | No | pie | The chart type to render. Supports: pie, doughnut, line, bar, radar and polarArea |
title |
string | No | - | Option to set a title for the chart. |
animate |
int | No | 1 | If the chart should be animated (1) or not (0). |
bezier |
int | No | 1 | If line charts should use bezier curves (1) or not (0). |
labels |
int | No | 1 | If labels should be shown in the chart (1) or not (0). Not all chart types use labels, it is mainly for bar and line charts where we have both an x and y axis. |
legend |
int | No | 1 | If a legend should be shown in the chart (1) or not (0). Not all charts show legends. |
width |
string | No | - | The chart canvas width. By default the chart will render full with of the container where the shortcode is used. Can be either a pixel value (without px) or a percentage value (with %). |
height |
string | No | - | The chart canvas height. Can be either a pixel value (without px) or a percentage value (with %). |
CSS Styling
.chart-container mycred-chart-container { }
.chart-container mycred-chart-container canvas.mycred-chart-canvas { }
Examples
Example 1: Default usage.
[mycred_chart_circulation]


